How Data Analytics can save lives
There are many negative consequences that can be directly linked to the crowding of the EDs in major hospitals. Of course, the worst of them is the mortality index, but also, staff morale, bottlenecks, resources and many others. Read on to understand how modern machine learning and data mining techniques can help save lives.
Background
I wrote this article based on my personal experience in a Canadian hospital. I intended to share some of the challenges and opportunities I observed in the healthcare system and explore how data analytics and technology can improve patient care. I hope this article will provide insight into the current state of healthcare in Canada and inspire others to consider ways in which technology and data can be leveraged to enhance care delivery. I also published on Medium.com
The Chaos of the Emergency Department
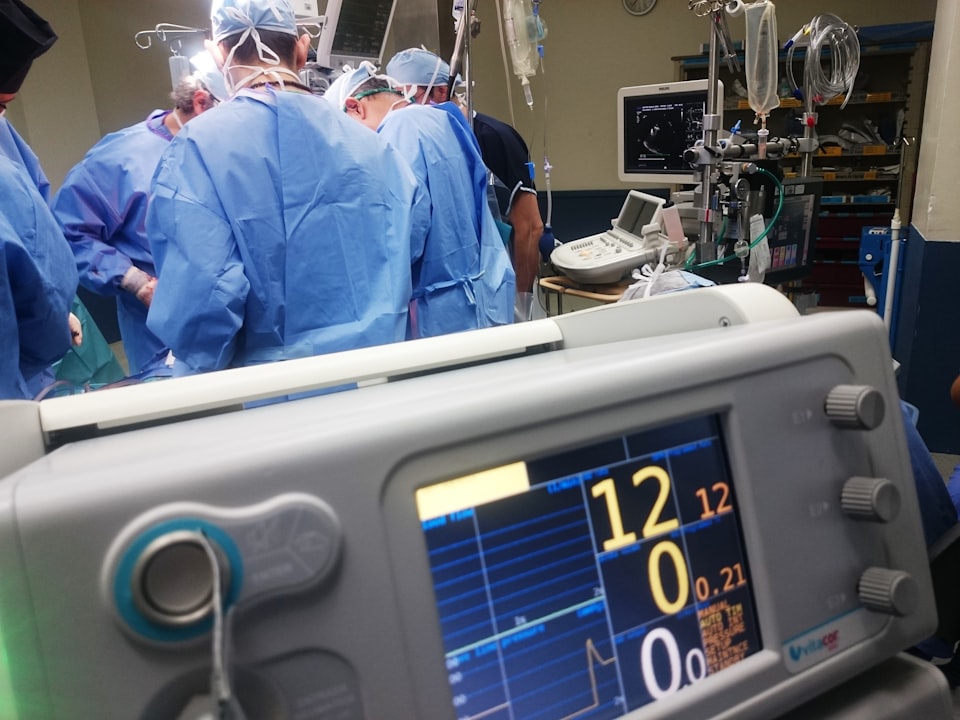
As I walked into the Emergency Department at the hospital, I could feel the chaos in the air. The staff seemed to be on edge, expecting the worst. This was a place where anything could happen at any moment. I made my way to the reception desk and was met with a long line of people waiting to be seen.
As I sat in the crowded waiting room of the Emergency Department, I couldn’t help but feel overwhelmed by the chaos around me. The constant flow of patients coming and going, the loud noises, and the frantic activity of the staff all added to the sense of confusion and disorder.
I had come to the hospital with a dull ache in my stomach that had turned into a sharp pain by the time I arrived. As the hours ticked by and the pain only seemed to worsen, I couldn’t help but feel frustrated by the long wait. I was told that the doctors were busy treating other patients with more severe injuries or illnesses and that I would have to be patient.
But patience was hard to come by as I watched the chaos unfold around me. At one point, a car accident victim was brought in on a stretcher, accompanied by a team of doctors and nurses rushing to stabilize her. At another, a man was brought in with severe chest pains, his face contorted in pain as he was rushed to a treatment room.
The atmosphere was frenzied and intense, and it was clear that the Emergency Department was stretched to its limits.
What would you do if you were in a very helpless situation in the emergency room?
No matter how many resources the hospital had prepared for the night shift, unexpected emergencies arose, causing a bottleneck in the system and a longer wait for patients.
According to the latest research, one of the biggest problems facing hospitals like this was transferring patients to inpatient beds. Whether it was a lack of space, the inability to move them, or simply a staff shortage, this was a constant source of frustration for both patients and staff. It was clear that this was a problem that needed to be addressed, as it not only affected the patients’ experience but also hurt the morale of the staff.
Data Analytics: The Key to Taming the Chaos in the Emergency Department
Despite the chaos and unpredictability of the Emergency Department, there are ways that data analytics can be used to improve the situation. By analyzing past trends and patterns in patient visits and emergencies, hospitals can better predict and prepare for future influxes of patients. This could involve everything from increasing staffing levels on certain days or times to improving the flow of patients through the department to reduce bottlenecks and wait times.
Data analytics can also identify areas where the hospital may fall short regarding resources or efficiency. For example, suppose the data shows that many patients are being transferred to inpatient beds due to a lack of space in the Emergency Department.
In that case, the hospital can address this issue by expanding the department or increasing the number of beds available.
Another Example from the Internet
One way that data analytics could be used to improve the chaos in the Emergency Department is by creating a heat map to visualize the busiest times and areas of the department. This could help hospital administrators identify patterns and decide how to allocate resources more effectively.
For example, suppose we have a dataset containing information about patient visits to the Emergency Department over a certain period, including the date and time of the stay, the location within the department (e.g., triage, treatment room), and the reason for the visit (e.g., chest pain, broken bone).
Using Python, we could create a heat map to visualize this data as follows:
import pandas as pd
import seaborn as sns
import matplotlib.pyplot as plt

# Load the dataset into a Pandas DataFrame
df = pd.read_csv('emergency_visits.csv')

# Create a pivot table to count the number of visits by location and hour
pivot = df.pivot_table(index='hour', columns='location', values='patient_id', aggfunc='count')

# Create a heat map using the pivot table and Seaborn
sns.heatmap(pivot, cmap='Reds')
plt.title('Emergency Department Visits by Location and Hour')
plt.xlabel('Location')
plt.ylabel('Hour')
plt.show()
This code would generate a heat map showing the number of patient visits to the Emergency Department by location and hour, with warmer colors indicating higher visits.
For example, suppose the map showed an exceptionally high concentration of visits to the triage area between 6 pm and 8 pm. In that case, this could indicate that this is a busy time for the department and that additional resources may be needed to handle the influx of patients.
We will base it on the study developed in two acute hospitals in Northern Ireland with over 120,000 patients to answer that question. Although they were using The Manchester Triage method, they could have lined up 200 patients in a 12-hour marathon to be seen.
In these hospitals, all stages of the patient assessment (four in total) were loaded into the internal information system in detail. This was enough for researchers to apply a data mining scheme and successfully predict which course a patient would take from the first intervention. Because of this, a bed for an inpatient could be asked for from the first assessment reducing waiting times and improving patient satisfaction drastically. Also, from a bigger picture, it could predict the number of beds needed for patients coming from the Emergency Department per day of the week and per period of the year.
Conclusion
In summary, the use of technology to enhance human life is increasing rapidly. From simple tasks to more complex ones, we are aided by advanced technologies. One area where technology could be beneficial is in healthcare. Data mining and machine learning may be the key to improving healthcare in Northern Ireland and potentially worldwide. By analyzing data and using machine learning algorithms, hospitals and healthcare providers can make more informed decisions, optimize resource allocation, and improve patient outcomes. In this way, technology has the potential to significantly enhance the healthcare system and improve the lives of patients.
Reference:
Member discussion